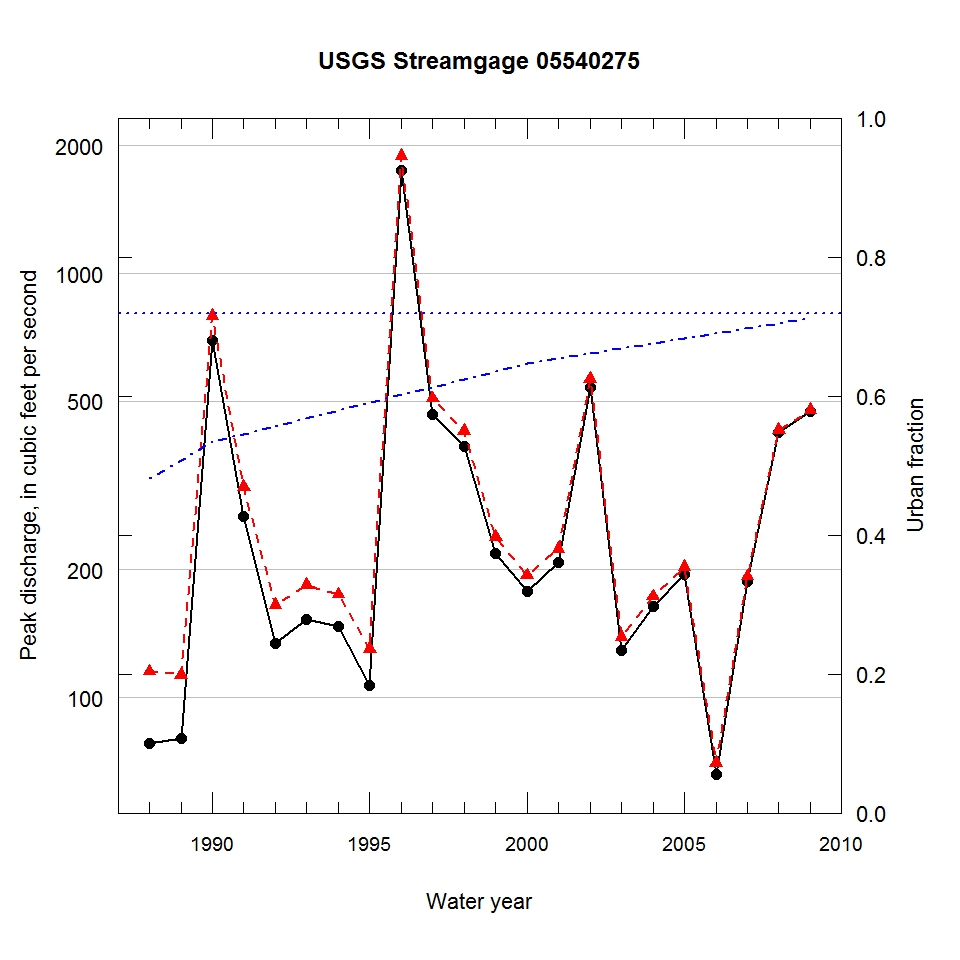
Observed and urbanization-adjusted annual maximum peak discharge and associated urban fraction and precipitation values at USGS streamgage:
05540275 SPRING BROOK AT 87TH STREET NEAR NAPERVILLE, IL


| Water year | Segment | Discharge code | Cumulative reservoir storage (acre-feet) | Urban fraction | Precipitation (inches) | Observed peak discharge (ft3/s) | Adjusted peak discharge (ft3/s) | Exceedance probability |
| 1988 | 1 | -- | 79 | 0.481 | 1.108 | 78 | 115 | 0.918 |
| 1989 | 1 | -- | 79 | 0.507 | 1.579 | 80 | 113 | 0.922 |
| 1990 | 1 | D | 79 | 0.534 | 1.808 | 694 | 793 | 0.010 |
| 1991 | 1 | -- | 79 | 0.545 | 1.478 | 267 | 314 | 0.195 |
| 1992 | 1 | E | 79 | 0.557 | 1.776 | 134 | 165 | 0.744 |
| 1993 | 1 | -- | 79 | 0.568 | 1.721 | 153 | 184 | 0.663 |
| 1994 | 1 | E | 79 | 0.579 | 0.712 | 147 | 175 | 0.704 |
| 1995 | 1 | -- | 79 | 0.590 | 1.270 | 107 | 130 | 0.876 |
| 1996 | 1 | -- | 79 | 0.602 | 3.675 | 1750 | 1890 | 0.000 |
| 1997 | 1 | -- | 144 | 0.613 | 2.517 | 465 | 507 | 0.039 |
| 1998 | 1 | -- | 144 | 0.624 | 1.251 | 391 | 425 | 0.071 |
| 1999 | 1 | -- | 144 | 0.635 | 0.599 | 218 | 239 | 0.429 |
| 2000 | 1 | C | 144 | 0.647 | 1.486 | 178 | 194 | 0.616 |
| 2001 | 1 | C | 144 | 0.654 | 0.694 | 208 | 224 | 0.489 |
| 2002 | 1 | C | 144 | 0.661 | 2.204 | 538 | 563 | 0.027 |
| 2003 | 1 | C | 144 | 0.668 | 0.902 | 129 | 139 | 0.843 |
| 2004 | 1 | C | 144 | 0.675 | 1.741 | 164 | 173 | 0.712 |
| 2005 | 1 | C | 144 | 0.683 | 1.191 | 195 | 203 | 0.574 |
| 2006 | 1 | CE | 144 | 0.690 | 1.625 | 66 | 70 | 0.981 |
| 2007 | 1 | C | 144 | 0.697 | 2.328 | 188 | 193 | 0.620 |
| 2008 | 1 | C | 144 | 0.704 | 2.736 | 422 | 427 | 0.069 |
| 2009 | 1 | C | 144 | 0.711 | 1.006 | 473 | 476 | 0.047 |

